


Could a Crisis-Specific KPI Dashboard Make Your Cost Control More Efficient?

By Ibrahim Lirar
The burden of COVID-19 mounts further, in tandem with the increasing number of “confirmed cases”, which is the key performance indicator (KPI) being monitored by decision-makers around the world.

Too often, organizations blindly adopt industry-recognized KPIs and then wonder why that KPI doesn’t reflect their own business and fails to affect any positive change.
KPIs in business is nothing new, how a business is choosing, updating and managing it’s KPIs can have a huge impact on the progress of the company. Commonly monitored KPIs such as profit margins, burn rates, net dollar retention rate, and customer acquisition costs.
These metrics, when chosen appropriately, allow leaders to continuously take the pulse of their companies and take action in response. Especially in the uncertain times, like the current shutdown or the expected recession of the global economy by the Coronavirus.
How to develop your personalized KPI system?
According to Daniel Diosi, “organizations blindly adopt industry-recognized KPIs and then wonder why that KPI doesn’t reflect their own business and fails to affect any positive change”.
In terms of developing a strategy for formulating KPIs, a team should start with the basics and understand what your organizational objectives are, how you plan on achieving them, and who can act on this information.
This should be an iterative process that involves feedback from analysts, department heads and managers. As this fact-finding mission unfolds, you will gain a better understanding of which business processes need to be measured with a KPI dashboard and with whom that information should be shared.
Keep in mind that a working system will require accurate data inputs and regular, preferably real-time or at least daily updates. Monthly reports or weekly snapshots are not sufficient for an efficient KPI monitoring system.
- Use a dynamic data visualization tool for your KPI systems, such as Google Data Studio, Microsoft Visio or KlipFolio
- Define your basic operational, financial, and sales marketing related KPIs
- Define KPIs that reflect on daily tasks and project progress and regular processes
- Define KPIs for each department and try to identify connections between cross-department trends
- Work out how to benchmark your results with peers and your own performance over time. With a dynamic data visualization tool, it is easy to compare performance by date ranges.
- Add forward-thinking, strategic KPIs that enable you to drive change in the long-term such as risk, sustainability and digitalization
- KPIs, both strategic and historical, should be as closely linked as possible to the top-level goals for your business.
How about crisis-specific KPIs for the hospitality industry?
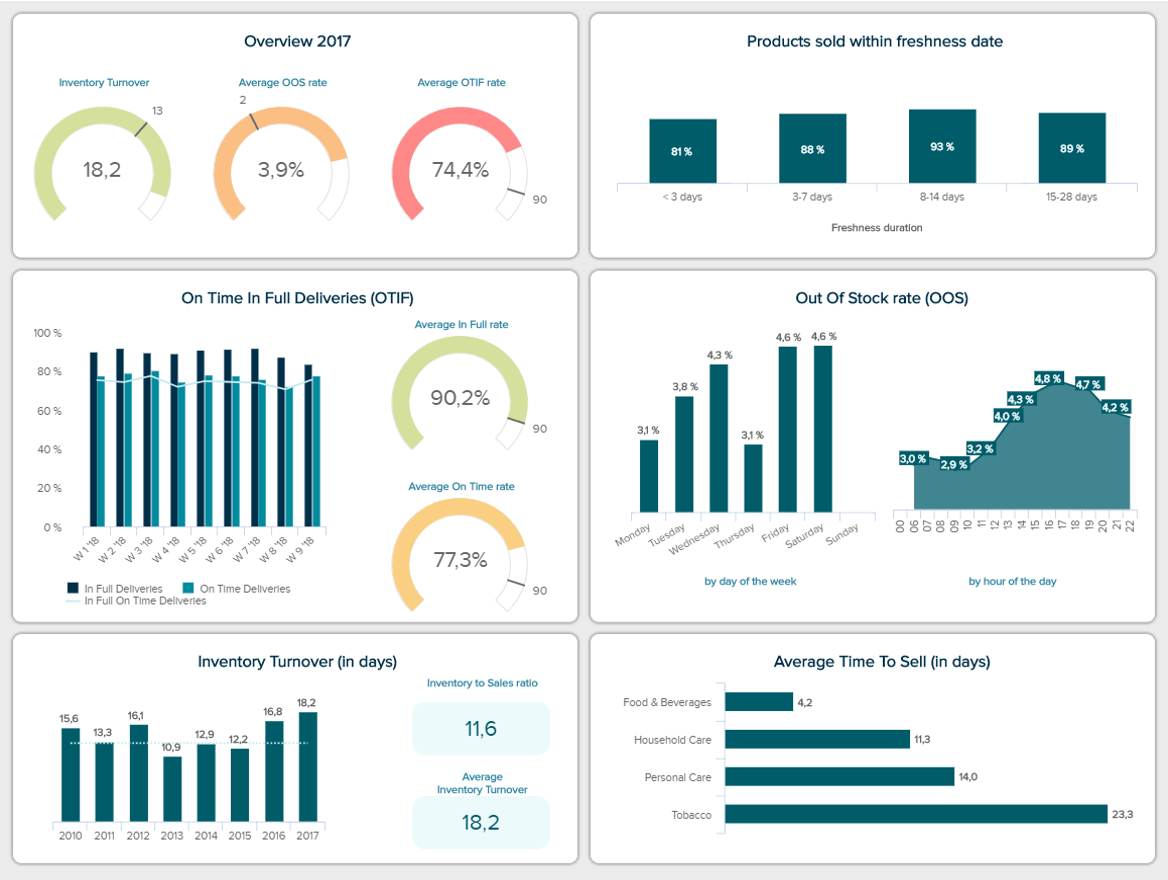
Similar to business development goals, crisis-specific KPIs should reflect your crisis measure goals. Important KPIs to consider would be cost control such as daily savings, reduced energy consumption, raw material consumption, utilization efficiency rate and dollar retention performance.
Collecting market-related business intelligence on dashboards in the form of easy-to-read metrics is similarly important. Such a business intelligence dashboard should include information country and segment-specific insights that are important for your sales and marketing. The number of confirmed cases, economic indicators and expected border reopening times can make planning for the recovery a lot more precise and efficient.
How to create and manage an actual KPI dashboard?
Building a dashboard is done by using databases, formulas and data visualization tools. These are basic input-output systems where one needs to maintain a data input, the dashboard app will do the necessary calculations and will visualize insights based on how it was configured.
Depending on the dashboard tool of your choice, you will need to supply data typically from databases, however simple Excel sheets, Google sheets are most commonly used too. More advanced visualization tools such as Klipfolio will enable you to connect a wide range of accounting or even hotel PMS solutions via APIs which makes reporting real-time and the connected dashboard fully automatic.
If such an integration is not available then your team will need to input data manually, either by overwriting and uploading data files or ideally using online input forms. Using web-based input forms is recommended, as it does not allow to tamper with previous data, minimizing the risk of the corruption of information.
Building a KPI dashboard should be done top-down. First define what KPIs you want to monitor, find out what data it will require to calculate those, then define the formulas that will be used for configuring the dashboard. At the end of the dashboard planning procedure, it will be clear what data is required for your formulas to be processed and visualized.
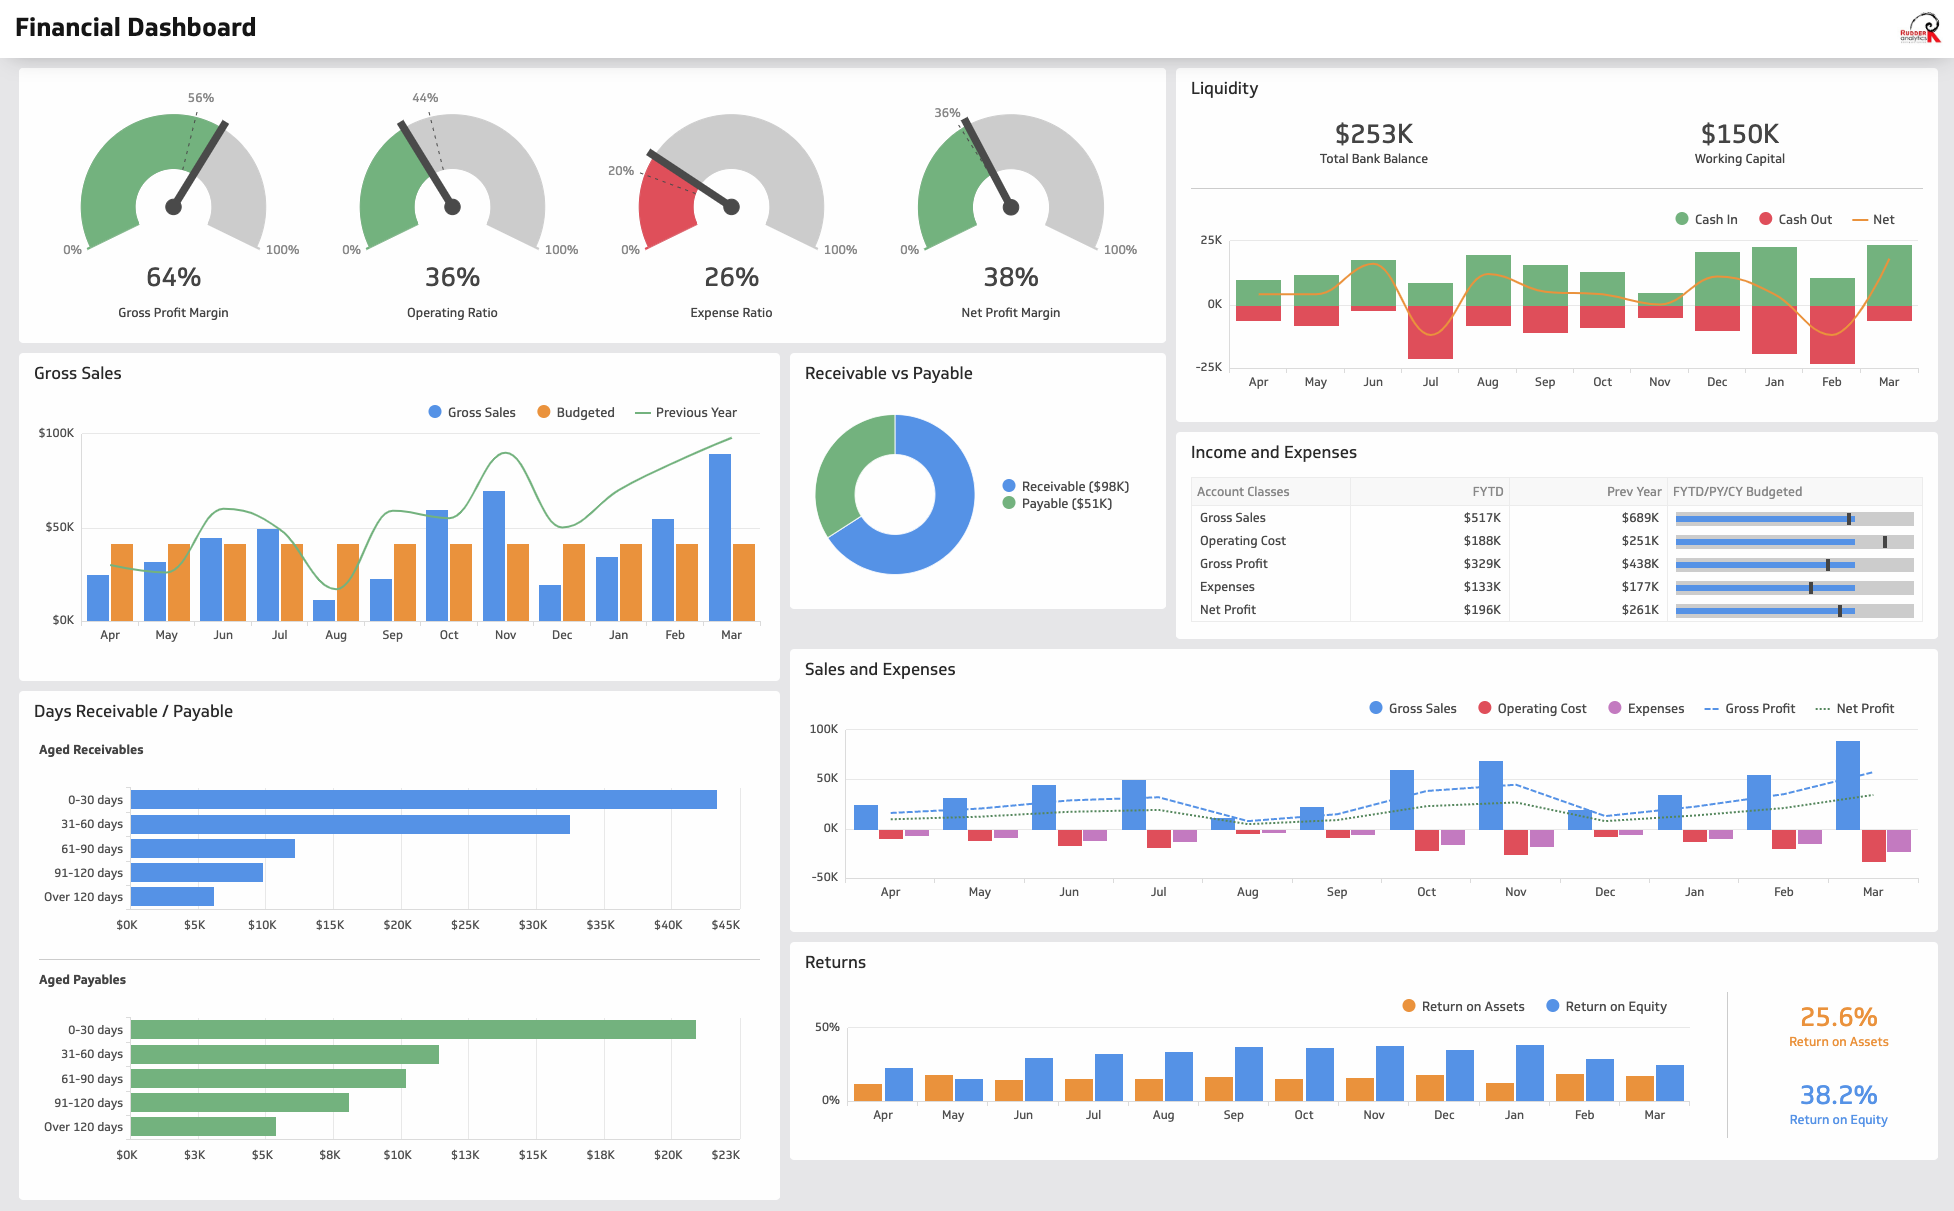
For example, a cost-control KPI dashboard that visualizes daily expenses should be based on formulas that work with utility consumption records, labour cost, food and raw materials in the background.
How to make a KPI dashboard work for you?
Possibly the greatest advantage of using dashboards is that important information will be always at your disposal real-time. With a dashboard, it is no longer necessary to ask and wait for reports that also involve the risk of human error. Doing it with dashboards is a lot more precise and efficient.
Going a step further, using dashboards makes it easier to cross-analyze information and identify important connection points between data and insights.
For example, reducing staff food cost drastically might cause a short term improvement in cost control efficiency but will likely cause an increase in sick leaves, medicine consumption and long term damage in staff retention rate, which will inflate recruitment costs.
Another textbook example is purchasing cheaper raw food materials which will initially reduce cost but will increase wastage and labour cost handing that wastage.
Connecting these points using cross-department dashboard systems can help to understand and manage business better in any situation.
Despite the huge assistance in the monitoring of insights for any purpose, reading dashboards and turning insights into strategies will require human intelligence.

About the Author:
Lirar is an experienced market researcher and a business analyst. He is closely associated with academia and scientific research organisations such as Manta Trust and International Union for Conservation Nature (IUCN).
He is the Maldives Partner in the consulting group, Daniel Diosi & Partners building local connections and sharing local information.